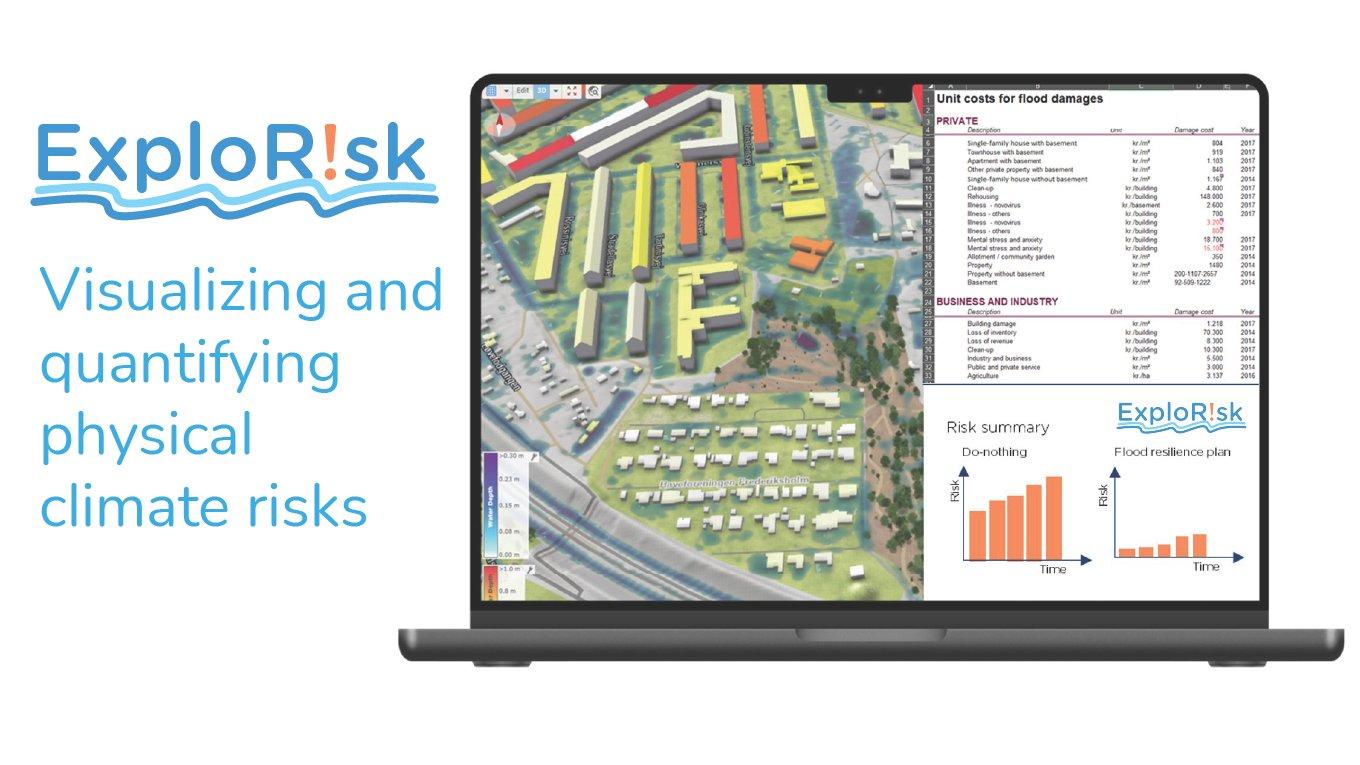
ExploRisk - visualising and quantifying physical climate risks
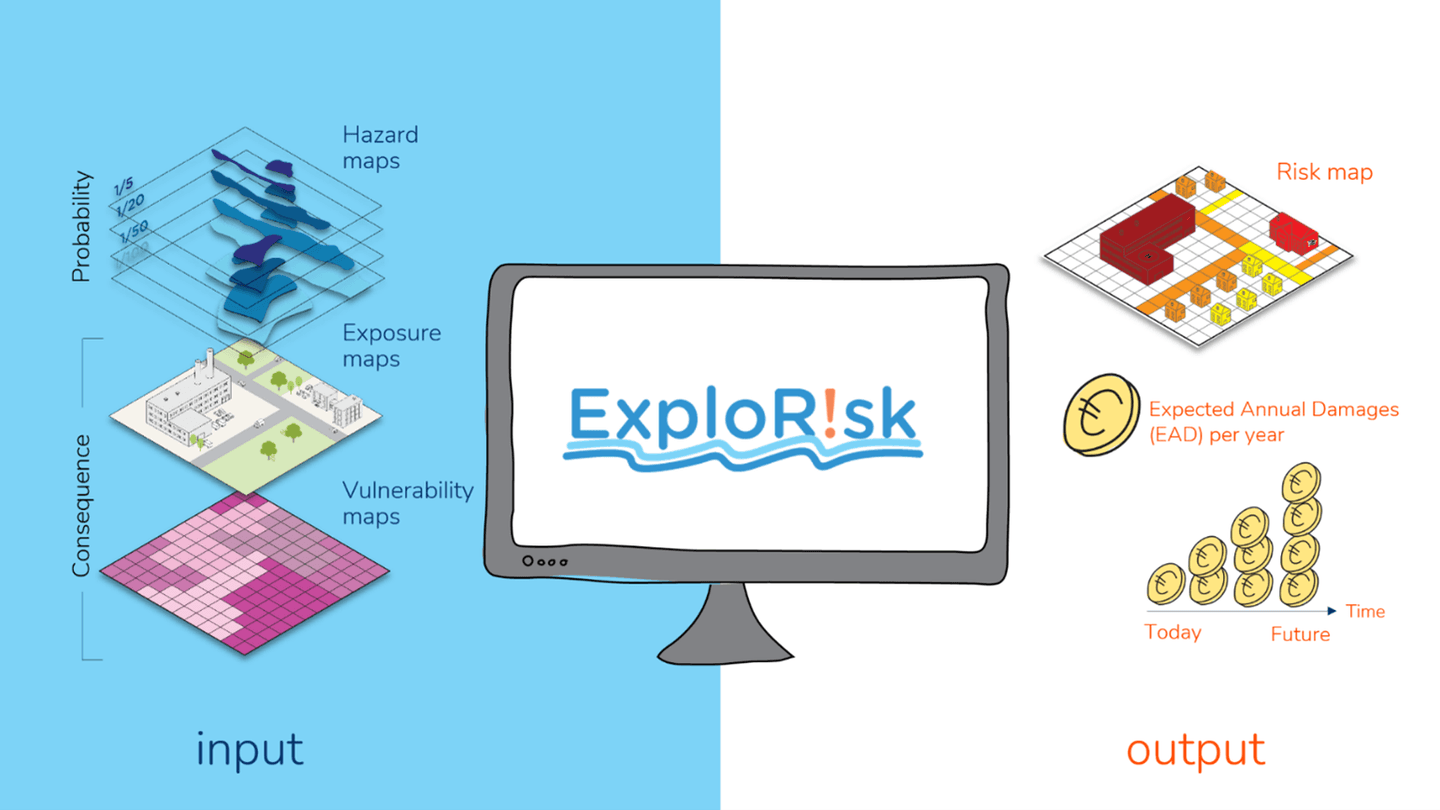
A GIS-based model that combines depth-damage curves, damage costs and/or vulnerability indices with the probability and spatial extent of a climate hazard.

Climate change is reshaping our reality, with significant shifts in everyday weather patterns and more frequent or intense climate extremes. As a result, communities, infrastructure, and ecosystems are facing new and evolving physical climate risks that can be difficult to anticipate and manage.
Understanding these climate risks is complex because they are not caused by a single factor. Instead, physical climate risk emerges from the interaction between climate hazards, exposure, and vulnerability. Each of these dimensions must be considered together to form a complete picture. These dimensions determine whether a hazard translates into an actual risk. For example, a flood event does not constitute risk if no vulnerable assets are exposed, but it becomes critical when vulnerable systems are affected. This complexity makes it challenging to map, quantify, and compare physical climate risks across locations and time.
- What type of hazard is expected, and how will it manifest in frequency and magnitude today and in the future?
- Which assets or living systems could be in danger, and which thresholds trigger exposure?
- How vulnerable are they to different climate hazards today and in the future?
Infrastructure owners, asset managers, governments and utilities alike are increasingly unfolding these and other questions as they try to grapple with their potential physical climate risks, from individual buildings to entire municipalities or countries.
ExploRisk is a GIS-based tool developed by Ramboll to visualise and quantify physical climate risks over time and space. In practice, it delivers both a quantification and visualisation of the current and future physical climate risks across a predefined area or collection of assets.
ExploRisk integrates spatial data on climate hazards (from other software or service providers) and their associated probabilities with spatial data of exposed assets and systems and their associated vulnerabilities. While this tool is particularly strong in flood-related assessments, it can work with any spatial climate hazard, provided probabilities and vulnerabilities are assigned.
ExploRisk quantifies vulnerability either through (1) an integrated database of damage costs per units (flooding only), (2) vulnerability matrices (any hazard), or (3) depth-damage curves (flooding only). Through this approach, ExploRisk enables working systematically with vulnerability, regardless of the type of hazard. While risk helps understand how big an impact and where the climate hazard manifests, the vulnerability stream also provides critical information as to relevant adaptation interventions and pathways.
ExploRisk produces two main outputs:
- Spatial maps highlighting hot spot areas and the spatial distribution of hazards, vulnerabilities, and physical climate risks (see example figures)
- A qualitative and/or quantitative assessment of risk over time for a wide range of scales, from single assets to entire neighbourhoods or towns. Where relevant ExploRisk can calculate the expected annual damages (EAD).
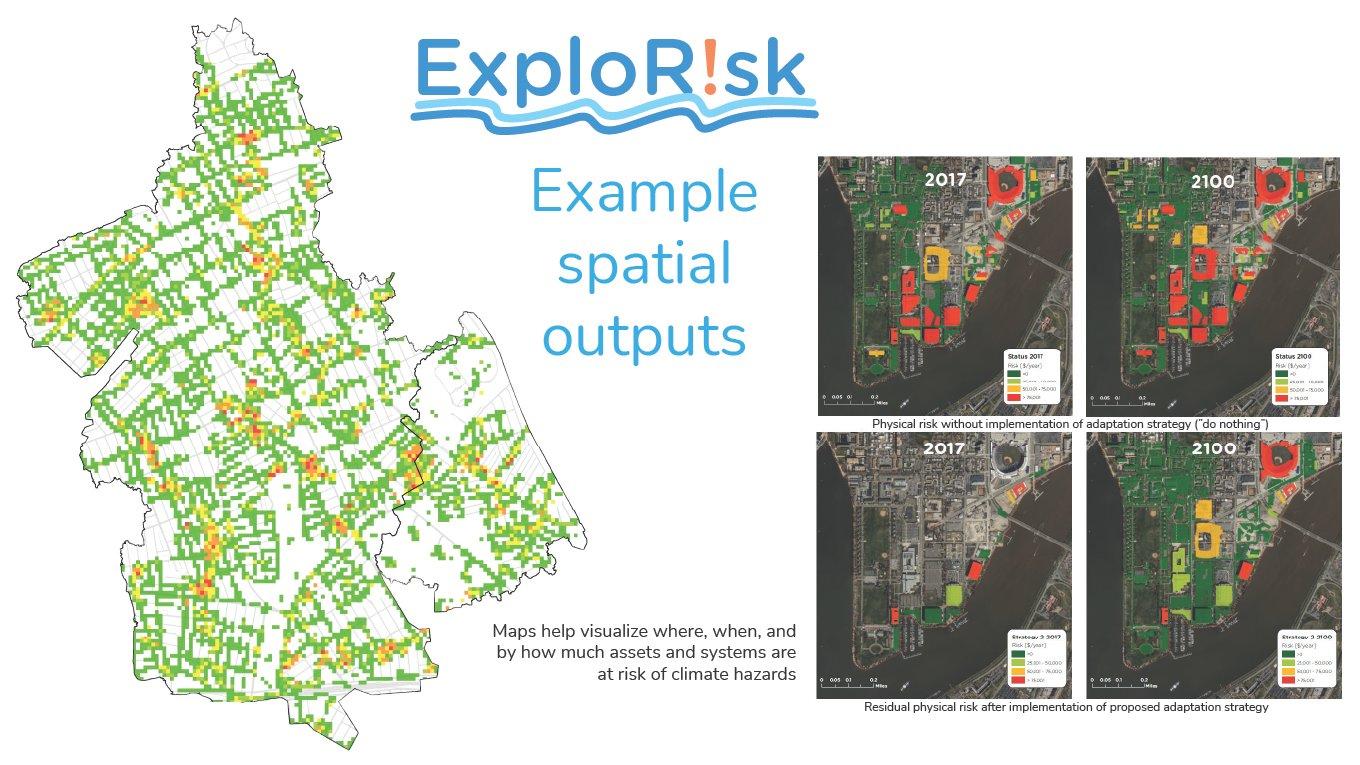
In most projects, ExploRisk helps document physical climate risk for a baseline (or “do nothing”) scenario to initiate the climate adaptation planning efforts, as well as a plan (adapted) scenario. By using ExploRisk the risk reduction effectiveness of different climate adaptation scenarios can be documented and a business case for climate adaptation investments be supported.