February 5, 2026
Ramboll launches first-of-its-kind European Biodiversity Metric
The European Biodiversity Metric (EBM) will provide a vital tool to assess and manage biodiversity across Europe, as well as supporting legislative compliance and advancing EU and global biodiversity goals.
January 30, 2026
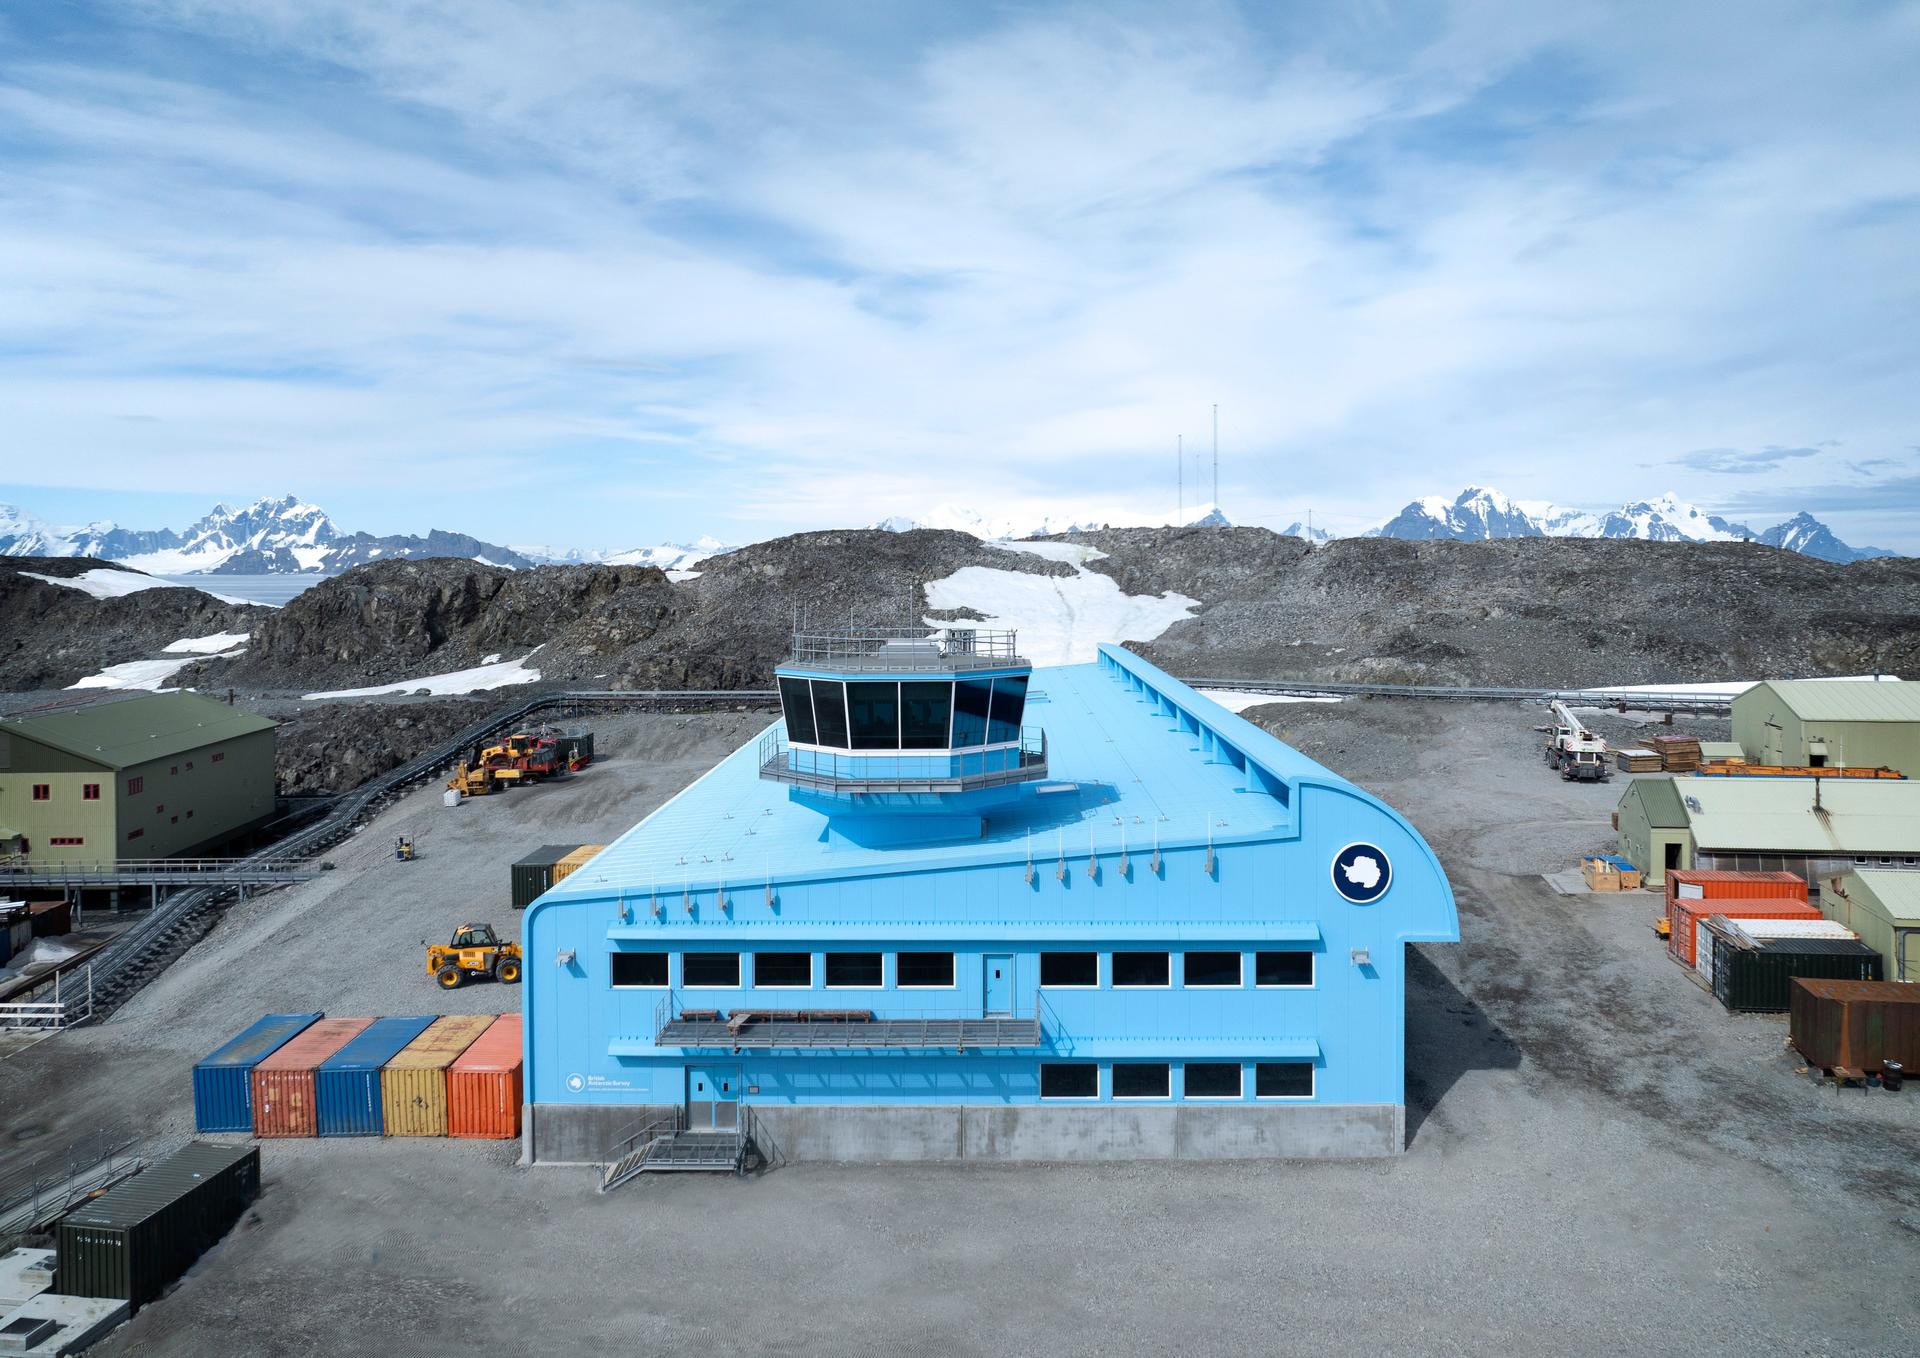
Largest UK Antarctic construction project completes on time and budget
The British Antarctic Survey (BAS) has officially opened the £100m Discovery Building at Rothera Research Station, marking the on-time and on-budget delivery of the largest construction project ever undertaken by the UK in Antarctica – a once-in-a-generation upgrade to the UK’s Antarctic research and operational capability.
January 28, 2026
Ramboll inventors revolutionise power grid stability with “universal shock absorber”
Ramboll inventors create “universal shock absorber” for the grid, making it easier and less risky to add renewable energy sources to the grid, preventing power outages, cutting costs of developing power systems around the world, and increasing resilience.
January 19, 2026
New Rail Atlas reveals Europe’s rail progress and gaps
European railway development is moving in the right direction, but progress towards achieving the EU’s core rail ambitions is fragmented and too slow, finds a new report by Ramboll. The European Rail Atlas identifies binding, multi-year investment frameworks as the single most powerful lever to close performance gaps and unlock a competitive, resilient, and low-carbon rail system across Europe.
January 7, 2026
Ramboll acquires Envidan
By joining forces with the Nordic water and wastewater specialist, Ramboll will add 500 experts to its global water practice, bolstering the practice in Denmark, Norway and Sweden, and add world-class expertise within water and wastewater treatment.
January 6, 2026
Ramboll appoints Christian Jensby as Group CEO
The Group Board of Directors of Ramboll has appointed Christian Jensby as Group CEO of the global architecture, engineering, and consultancy company with 18,000 specialists and operations in 35 countries.
December 4, 2025
CEO Jens-Peter Saul is leaving Ramboll
After almost 14 years as CEO of the Ramboll Group, the Group Board of Directors and Jens-Peter Saul have decided it is time for a change of guard. Jens-Peter Saul will continue in his position until a successor has been found.
November 11, 2025
UNEP, COP30 Presidency, and Ramboll partner to tackle the threat of urban heating
Ramboll joins the UNEP and COP30 Presidency-led Beat the Heat program at COP30, the UN Climate Change Conference, aiming to address the challenges of extreme heat through sustainable cooling solutions. The cities of New York and Copenhagen take a lead role in rolling out the initiative.
October 30, 2025
TIME100 Climate list recognises Ramboll CEO Jens-Peter Saul for climate leadership
The list celebrates leaders making a significant impact in tackling climate change.
October 28, 2025
Ramboll at COP30 and World Mayors Summit
Join Ramboll at the C40 World Mayors Summit and COP30 in Brazil in November 2025, where we will be at the forefront of critical conversations on sustainability and climate action. Participate in our events, engage in networking opportunities, and connect with our leading experts as we explore innovative solutions for a sustainable future.


